Creating charts using the GDX Data Browser |


|
|
The GAMS model library contains a GAMS model chartdat.gms. Running this model will create a GDX file called chartdata.gdx which will be used in the following examples.
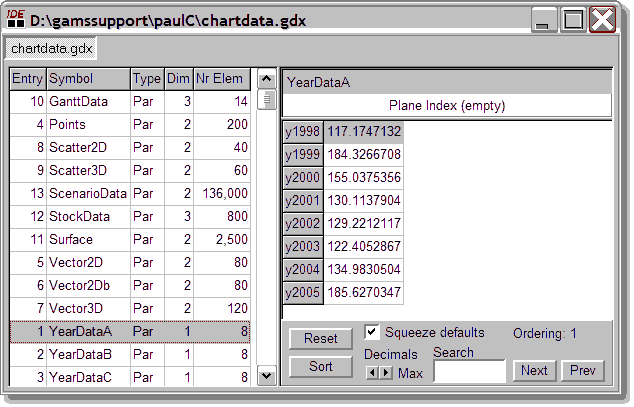
The Graph sub-menu contains dimension entries, with only one entry enabled. The dimension that is enabled reflects the dimension of the data shown in the data viewer. To follow along, open the chartdata.gdx file, and select the symbol YearDataA.
 GDX DataViewer with parameter YearData selected
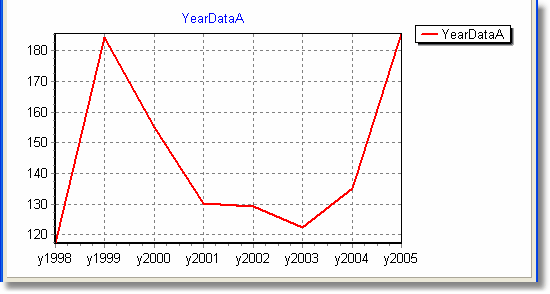
On the PopUp menu, select: Graph | One dimension | Line chart. A new tab will be created showing the resulting chart. Many aspects of a chart, such as axis titles, titles, colors etc. can be changed using the Chart Editor.
 Line chart for YearDataA
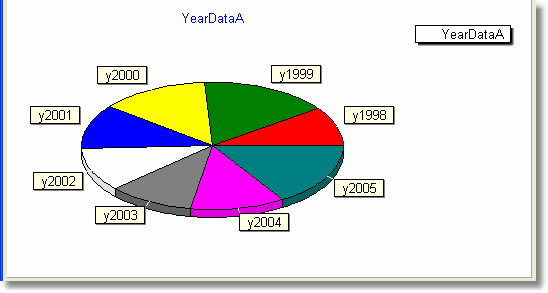
The same data can be displayed as a Pie chart: Select the tab showing chartdata.gdx On the PopUp menu, select: Chart | One dimension | Pie chart.
 YearDataA as a Pie chart
Note that the filename used for this chart is based on the name of the GDX file and the name of the symbol. Creating the Pie chart replaced the file we just used for the Line chart. This could have been avoided by saving the line chart under a different name: Main menu: File | SaveAs
Using the GDX Data Browser, we can only make a chart for a single symbol. Multiple symbols can be combined in a single chart when we edit the Chart file
|