GDX data browser display |


|
|
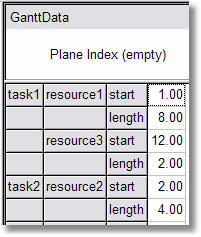
 The data grid shows the values for the symbol
After selecting a symbol, the window on the right shows the data for the selected symbol. The data window is divided in two areas: the plane index and the data. The indices used can be re-arranged, using the mouse using a drag and drop mechanism. To move an index, move the mouse cursor to the source location, select the source my pressing down the left mouse button and while holding down the button, move to the target location and release the mouse button.
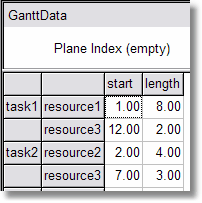
 The last column was dragged to be display as the header
An index can be moved between rows and columns in the data display, and be moved between the data and the plane index. Such an arrangement is stored in the project file, and will be used when the symbol is displayed again.
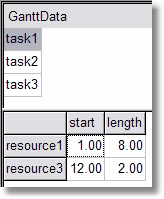
 The left most column was moved to the plane index. The data displayed is now filtered for the selected row in the plane index
When we rearrange the data display, the current re-arrangement of the indices is displayed at the bottom of the screen. The vertical bar indicates where the plane index stops and where the displayed data begins.
 Ordering of indices
|